Announcing Omlet — component analytics for developers and design system teams

Pelin Kenez

Today, I'm super excited to announce that we're launching Omlet 1.0 — component analytics for developers and design system teams. 🎉
After an exciting beta with design system teams at Instacart, Optimizely, HelloFresh, and many more, we’re opening the door for all teams to experience Omlet.
Back in 2014, when we started working on Zeplin in Istanbul, we had one goal in mind: to help teams build beautiful products. Over all these years, we had the chance to work with thousands of product teams and we learned a ton from them. The deeper we researched, the more issues we found.
…so in the last couple of years, we decided to focus on a challenge we were constantly hearing from teams building or maintaining design systems — not having enough actionable data for measuring and understanding design system usage and adoption in the codebase. That was the start of Omlet, our second product at Zeplin.
Get to know Omlet
Omlet is a component analytics tool that eliminates manual measurement tasks and speeds up decision-making for component library improvements by providing usage analytics. With Omlet’s code-level component tracking and pre-built dashboards, your team can get data-driven visibility into design system adoption, evolve your libraries with confidence, and free up valuable design system engineer resources.
In short, it helps front-end teams spend more time building components and less time on manual tasks trying to figure out which components to work on.
🔗 Start tracking your components today: https://omlet.dev
The reason why we're building Omlet
During our early research, we met with some brilliant developers who are building a library of components and scaling a design system — including Salesforce, GitHub, Segment and Optimizely. Their goal was to drive the adoption of component libraries and the design system, but they struggled to gain visibility on the usage.
We kept hearing the same questions again and again:
- “How is my component adopted over time?”
- “What new components are emerging, and which ones are being used?”
- “If I update or deprecate this component, how would that affect my team?”
- “Am I making the right improvements?”
How could you answer these questions if you don’t have visibility into production code usage? To answer their questions, the teams were manually writing scripts, and doing hacky visualizations.
Here’s how Omlet works
Omlet analyzes your production code, parses your components and collects usage data on all components. It then provides a dashboard where you’ll find a variety of out-of-the-box charts to help you compile the most common data points that your team would find useful.
This immediately gives your team the ability to automate component visibility, identify usage trends, and prove design system value — with virtually no manual work.
Let’s see some specific ways Omlet gives value.
Get instant component insights
Once you run Omlet CLI, it statically analyzes your codebase (JavaScript/TypeScript) and detects React components and usages. From there, you gain instant visibility into usage analytics, such as:
- How components across projects are adopted over time
- The adoption rate of components in production
- When new (/custom) components have been added to the codebase
You can take this data further too.
Omlet automatically collects all your reusable and custom components across all projects. This makes it easy to search for components, and also filter them by their name, tag, date created, and other criteria.

With this complete view of all components across all your projects, you can quickly see what new custom components are being created and review whether they should be added to your design system.
We heard that teams are building and maintaining custom scripts and supplementing with additional visualization tools to get to this level of visibility into component usage. With Omlet, this is all taken care of for you — saving your team time and money on internal dev resources.
With Omlet, we have a better idea of where and how our components are used, without going into codebase or terminal, which makes collaboration with designers much more efficient.
Hoshi’ki, Software Engineer, Design System at Optimizely
Evolve your design system with confidence
Omlet’s Analytics Dashboard also provides multiple out-of-the-box charts to help you visualize usage data so you can quickly identify emerging trends or usage gaps — all without any set-up effort. Here are a few chart visualizations in Omlet our early users are loving:
Historical usage trends: Compare the usage between core and custom components over time, as well as how components are adopted across projects.
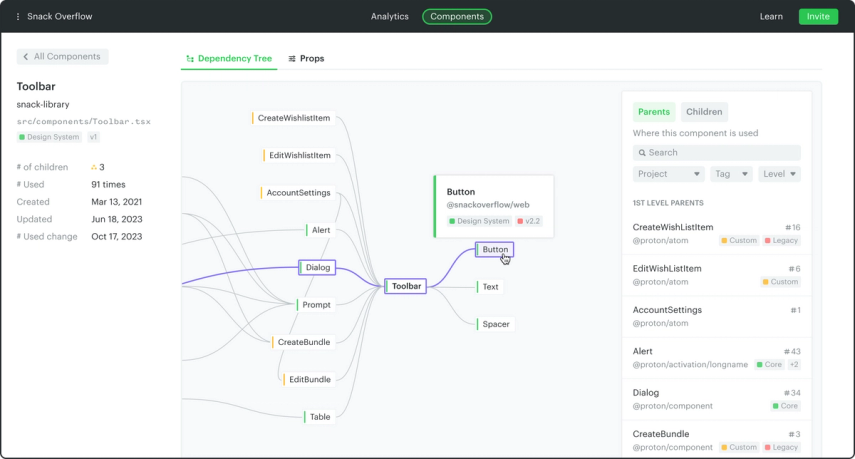
Dependency tree: Easily see and track the relationship between components, such as how many children they have, and more importantly, exactly where they are being used.
Depending on your design system maturity, your team might need to track different metrics or measure different things. That’s why Omlet also lets you create custom analyses.
For example, it’s pretty common for teams to iterate on their design system and maintain multiple versions. You might wonder “how do different teams and projects adopt the latest version of your design system?” You can instantly answer that question in Omlet by analyzing your projects based on tags.
Tags allow you to group your components and are customizable. You can tag your components based on different properties, depending on your needs.
These powerful visualizations give your developers the data points they need to not only accurately track design system adoption but also make confident decisions to improve and scale it efficiently. Oh, again — no need to build and maintain any custom scripts or visualizations.
Having built a similar tool in the past in order to prove a design system’s worth to stakeholders, I’m happy I can simply use Omlet now and spend more time building components instead.
Andre Luiz Rabello, Senior Frontend Engineer at Primer
Prove the value of your design system with data
By having access to Omlet’s component usage insights, your team can do something with your design system you always knew was necessary but feels almost impossible given existing tooling — use tangible data to prove its value and support data-driven decision making.
For example, our early users regularly rely on Omlet’s usage insights to:
- Allocate development resources
- Improve cross-functional collaboration around the design system
- Demonstrate the value of the design system to executives
When I tried Omlet, it was magical. I had a dashboard in a couple of minutes with everything being tracked and visualized.
Dan Mall, Founder of Design System University
What’s new in Omlet 1.0?
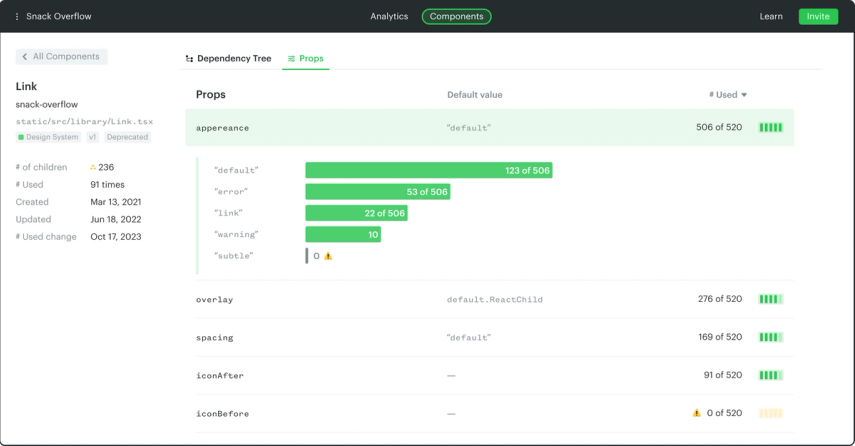
Prop Tracking
OK… This was probably the most requested feature during the beta. I’m very excited to share that Omlet now also tracks prop usages. While viewing components in Omlet you can drill down to see usage numbers for all their props, as well as what values are being sent to each prop.
This gives your team even more usage insights to help make better decisions on what to add, remove, or adjust in your design system.
Updated Analytics Dashboard
Analytics Dashboard also got an overhaul. We’ve updated the out-of-the-box charts and also categorized them into 3 sections that help you understand how your design system is used overall, how you can increase component adoption, and how you can simplify your code library.
Along with these updates, we’ve also done a bunch of improvements behind the scenes to gather more accurate component usage data from your codebase.
What’s next?
Custom Dashboard
On top of our out-of-the-box dashboards, you’ll soon be able to customize your dashboards, too. This opens up endless ways for your team to view, analyze, and take action on Omlet’s usage insights to support your team’s broader design system strategy and roadmap.
Start measuring your design system
We’re building Omlet to be an end-to-end toolchain for developers to increase design system adoption in the codebase and this launch is our first big step towards that vision. Down the line we want to go beyond usage analytics and support developers as they code, pointing them to the right design system resources.
Join us now to evolve your component library with confidence and prove the value of your design system. We're excited to hear what you think, give Omlet a go using our free 30-day trial!